Basic Annotation with Marker Files
This vignette covers the fundamental steps to use CASSIA for cell type annotation when you already have marker gene lists prepared. This is ideal when you've already performed clustering analysis and want to annotate your clusters.
1. Installation and Setup
Before using CASSIA, you need to install it and set up the necessary environment.
1.1 Package Installation
# Install prerequisite packages install.packages("reticulate") install.packages("devtools") # Install CASSIA from GitHub library(devtools) devtools::install_github("ElliotXie/CASSIA/CASSIA_R") # Load the CASSIA package library(CASSIA)R
1.2 Python Environment Setup
CASSIA relies on Python for some backend operations. The environment will be set up automatically when you load the package, but if you encounter issues, please run the following command to manually set up the Python environment:
# Manually set up the Python environment setup_cassia_env(conda_env = "cassia_env")R
1.3 API Key Configuration
CASSIA requires at least one API key to function. We recommend setting up API keys for OpenRouter, OpenAI, and Anthropic for the best experience:
# Set up API keys (replace with your actual keys) setLLMApiKey("your_openrouter_api_key", provider = "openrouter", persist = TRUE) setLLMApiKey("your_openai_api_key", provider = "openai", persist = TRUE) setLLMApiKey("your_anthropic_api_key", provider = "anthropic", persist = TRUE)R
Setting persist = TRUE saves the key to your .Renviron file for future sessions.
2. Working with Marker Files
CASSIA works with marker gene data, typically produced by differential expression analysis tools like Seurat's FindAllMarkers function.
2.1 Required Format
CASSIA accepts two marker file formats:
1. Raw FindAllMarkers Output (recommended):
The direct output from Seurat's FindAllMarkers function, which should contain these essential columns:
cluster: Cluster identifiergene: Gene name/symbolavg_log2FC: Log fold changep_val_adj: Adjusted p-valuepct.1: Percentage of cells in the cluster expressing the genepct.2: Percentage of cells outside the cluster expressing the gene
# Example of raw FindAllMarkers output format head(markers) # p_val avg_log2FC pct.1 pct.2 p_val_adj cluster gene # 1 0 3.02 0.973 0.152 0 0 CD79A # 2 0 2.74 0.938 0.125 0 0 MS4A1 # 3 0 2.54 0.935 0.138 0 0 CD79B # ...R
2. Processed Format:
A simplified format with cluster IDs and comma-separated gene lists:
# Example of processed marker format head(markers_processed) # cluster marker_genes # 1 0 CD79A,MS4A1,CD79B,HLA-DRA,TCL1A,HLA-DRB1,HLA-DQB1,HLA-DQA1,... # 2 1 IL7R,CCR7,LEF1,TCF7,FHIT,MAL,NOSIP,CMTM8,TRABD2A,... # ...R
2.2 Sample Data
For this vignette, we'll use the example data included with CASSIA, which contains clusters from a large intestine dataset with six distinct cell populations:
- Monocyte (Original annotation is inaccurate, this cluster should be Schwann Cell instead. More evidence can be found in the paper)
- Plasma cells
- CD8-positive, alpha-beta T cell
- Transit amplifying cell of large intestine
- Intestinal enteroendocrine cell
- Intestinal crypt stem cell
# Load example marker data in both formats markers_unprocessed <- loadExampleMarkers(processed = FALSE) # Direct Seurat FindAllMarkers output markers_processed <- loadExampleMarkers(processed = TRUE) # Processed format # Preview both data formats head(markers_unprocessed) head(markers_processed)R
3. Running Basic Annotation
3.1 Fast Mode (All-In-One)
For a quick, comprehensive analysis that performs all steps at once:
# Run the complete CASSIA pipeline in fast mode fast_results <- runCASSIA_pipeline( output_file_name = "CASSIA_Results", tissue = "large intestine", species = "human", marker = markers_unprocessed )R
For details about each parameter, please refer to the Fast Mode documentation.
Below is the default and recommend setting for a cost efficient analysis.
fast_results <- runCASSIA_pipeline( output_file_name = "FastAnalysisResults", tissue = "large intestine", species = "human", marker = markers_unprocessed, max_workers = 6, annotation_model = "google/gemini-2.5-flash-preview", annotation_provider = "openrouter", score_model = "deepseek/deepseek-chat-v3-0324", score_provider = "openrouter", score_threshold = 75, annotationboost_model = "google/gemini-2.5-flash-preview", annotationboost_provider = "openrouter", merge_model = "deepseek/deepseek-chat-v3-0324" max_retries = 2 )R
3.2 Detailed Batch Analysis
For more control over the annotation process:
output_name="CASSIA_analysis" # Run batch analysis with OpenRouter batch_results <- runCASSIA_batch( marker = markers_unprocessed, output_name = output_name tissue = "large intestine", species = "human" )R
3.3 Quality Scoring
Evaluate the quality of the annotations:
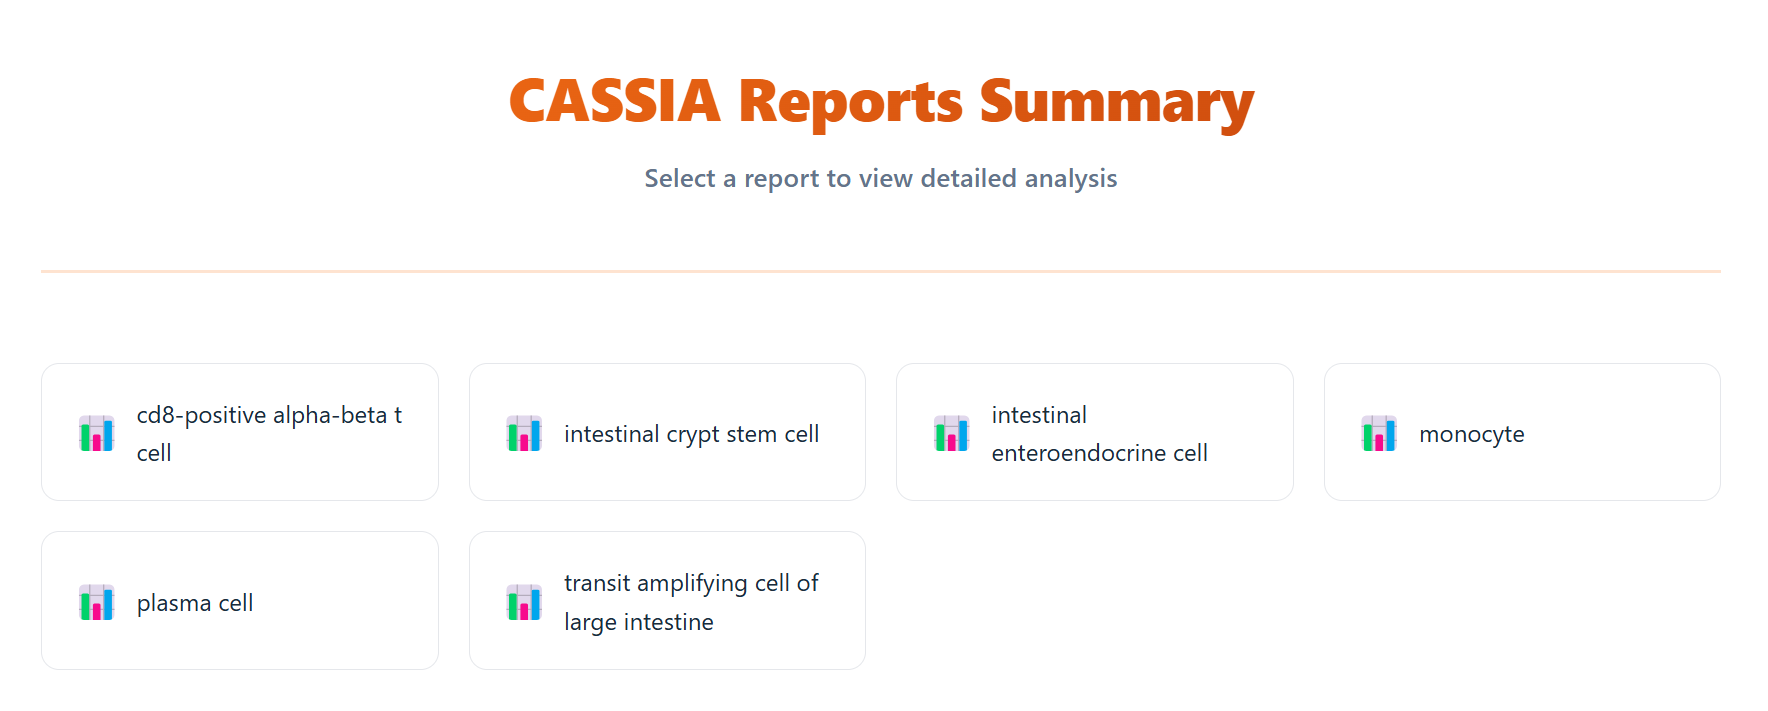
# Run quality scoring quality_scores <- runCASSIA_score_batch( input_file = paste0(output_name, "_full.csv"), output_file = paste0(output_name, "_scored.csv") ) # Generate annotation html report runCASSIA_generate_score_report( csv_path = paste0(output_name, "_scored.csv"), output_name = paste0(output_name, "_report.html") )R
The result routing html page is shown below, you can click the button to navigate to the corresponding cluster.
4. Interpreting Results
The HTML report provides a visual summary including:
- Quality scores and reasoning across clusters
- Detailed annotation information for each cluster
For clusters with low scores (<75), consider:
- Checking if the tissue type was correctly specified
- Verifying that the species is correct
- Examining cluster quality through basic QC metrics, doublet detection, and ambient RNA removal
- Using additional analysis methods like those described in the next section
5. Next Steps
After basic annotation, you can explore additional CASSIA capabilities.