Extended Analysis with Optional Agents
This vignette demonstrates how to use CASSIA's optional agents for deeper analysis and validation, starting from a provided marker file. These agents help you:
- Assess annotation uncertainty
- Boost annotation quality for specific clusters
- Compare similar cell types
- Perform subclustering and analyze subpopulations
1. Uncertainty Quantification
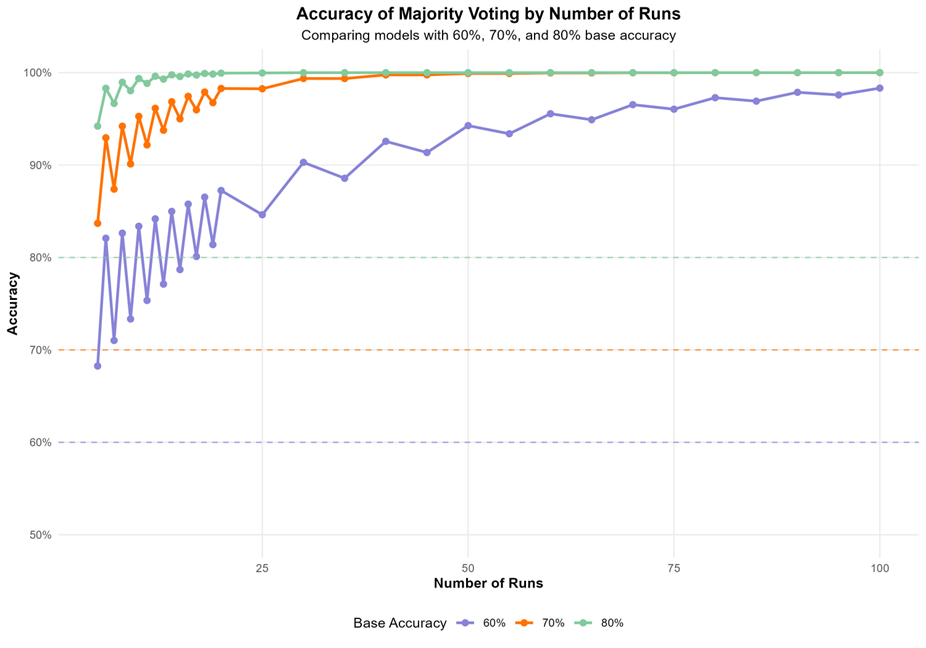
Run multiple annotation iterations to increase the accuracy and assess the stability of your results:
Assuming 80 percent of accuracy, by repeating the annotation 5 times, the accuracy will increase to around 95 percent.
# Run multiple iterations runCASSIA_batch_n_times( n = 5, marker = markers_unprocessed, output_name = "CASSIA_Uncertainty", tissue = "large intestine", species = "human", max_workers = 6, # How many workers to use for each batch batch_max_workers = 1 # How many batches to run in parallel ) # Calculate similarity scores runCASSIA_similarity_score_batch( marker = markers_unprocessed, file_pattern = paste0(output_name,"_Uncertainty_*_full.csv"), # The file pattern of the uncertainty results output_name = "cs_results", max_workers = 6 )R
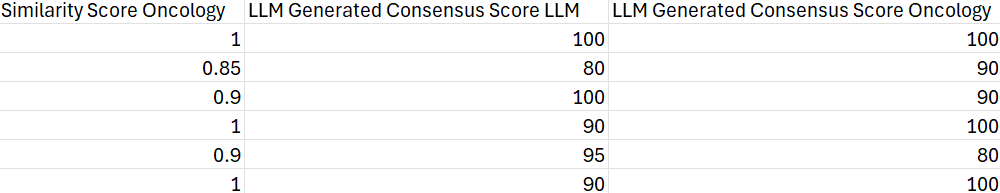
The results contain the consensus cell type annotation and the consensus similarity score for each cluster. Clusters with similarity scores lower than 75 should be flagged for further examination, as they indicate potential annotation uncertainty or heterogeneous populations.
The consensus similarity score provides a quantitative measure of annotation stability across multiple iterations. Higher scores indicate greater confidence in the annotation.
2. Annotation Boost on Selected Cluster
The monocyte cluster is sometimes annotated as mixed population of immune cell and neuron/glia cells.
Here we use annotation boost agent to test these hypothesis in more detail.
# Run validation plus for the high mitochondrial content cluster runCASSIA_annotationboost( full_result_path = paste0(output_name, "_full.csv"), marker = markers_unprocessed, output_name="monocyte_annotationboost2", cluster_name = "monocyte", major_cluster_info = "Human Large Intestine", num_iterations = 5, model = "anthropic/claude-3.5-sonnet", provider = "openrouter" )R
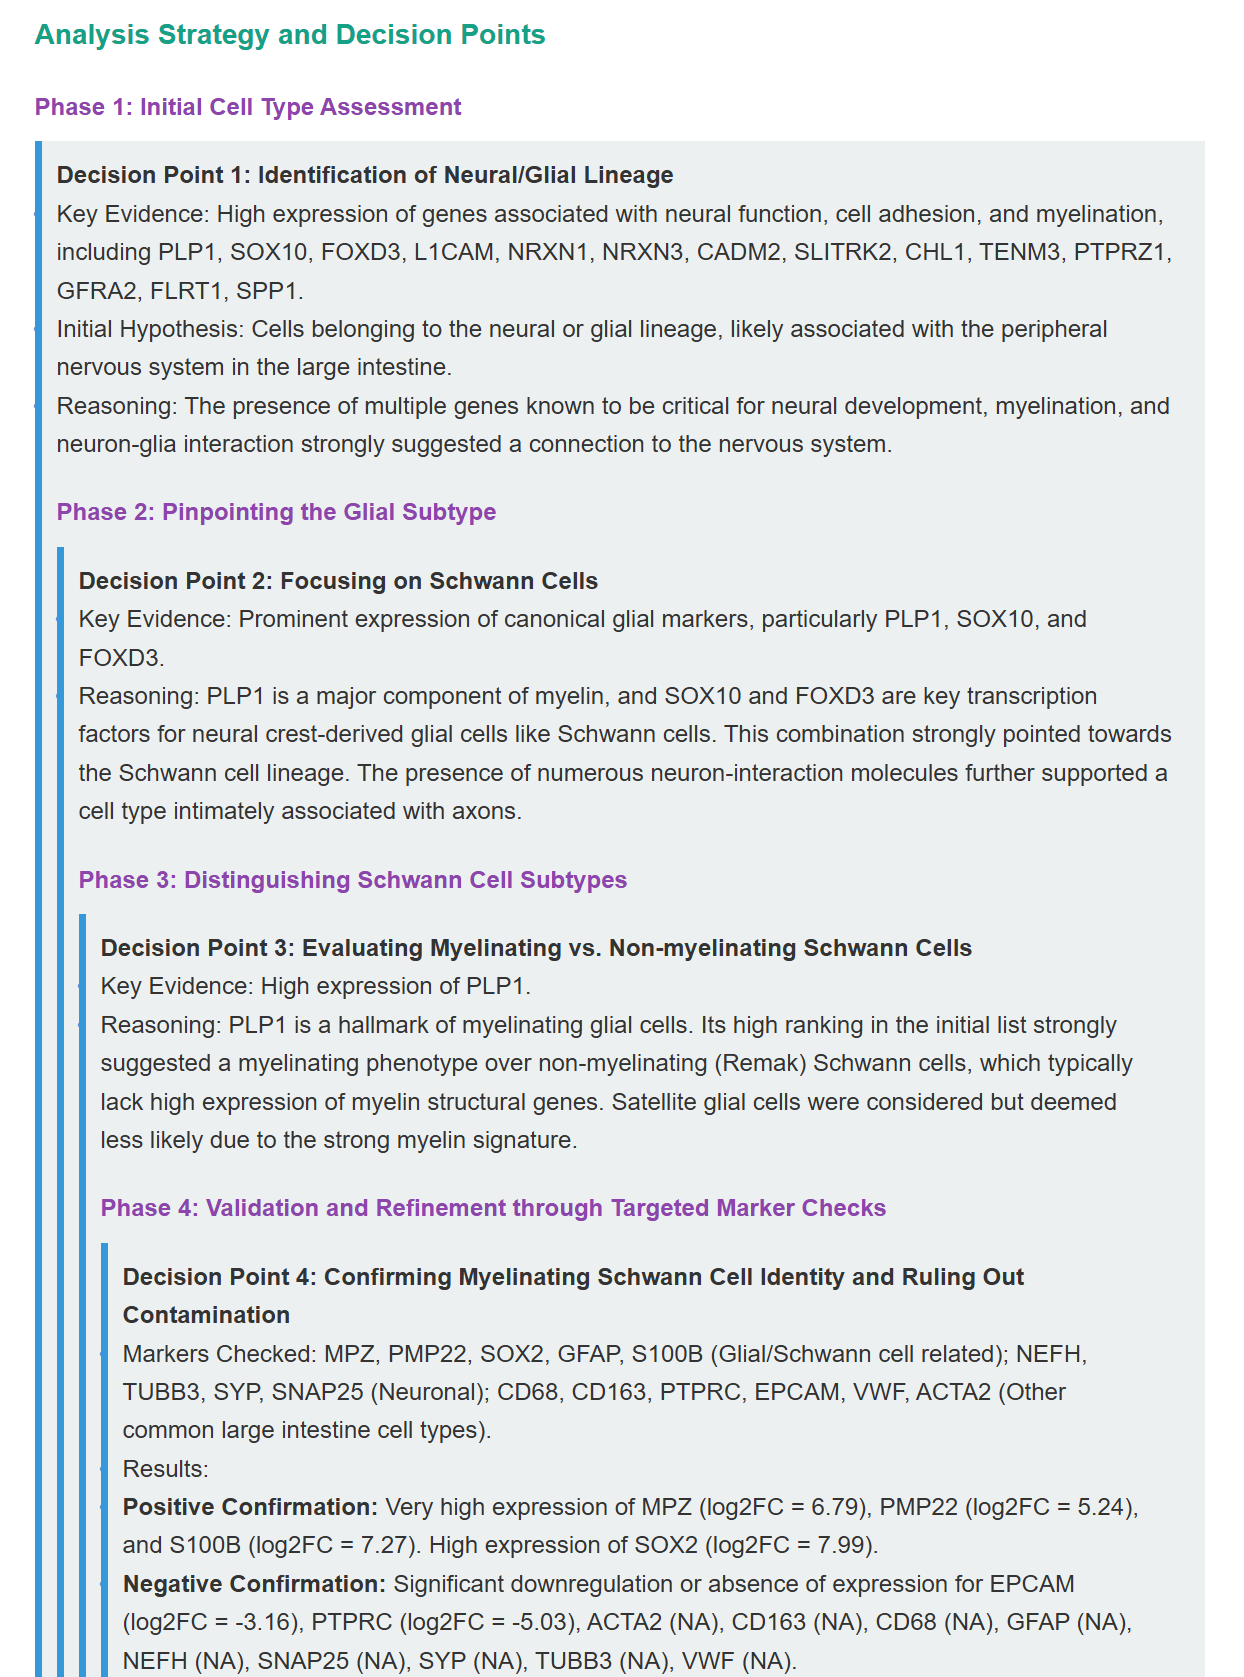
A detailed report will be generated. The report provides in-depth analysis of the monocyte cluster. Part of the result is shown here:
3. Compare Cell Types
This agent can be used after you finish the default CASSIA pipeline and are still unsure about a cell type. You can use this agent to get a more confident subtype annotation. Here we use the Plasma Cells cluster as an example to distinguish if it is more like a general plasma cell or other cell types. The models used by default are the thinking-based advanced models.
#The marker here are copy from CASSIA's previous results. marker="IGLL5, IGLV6-57, JCHAIN, FAM92B, IGLC3, IGLC2, IGHV3-7, IGKC, TNFRSF17, IGHG1, AC026369.3, IGHV3-23, IGKV4-1, IGKV1-5, IGHA1, IGLV3-1, IGLV2-11, MYL2, MZB1, IGHG3, IGHV3-74, IGHM, ANKRD36BP2, AMPD1, IGKV3-20, IGHA2, DERL3, AC104699.1, LINC02362, AL391056.1, LILRB4, CCL3, BMP6, UBE2QL1, LINC00309, AL133467.1, GPRC5D, FCRL5, DNAAF1, AP002852.1, AC007569.1, CXorf21, RNU1-85P, U62317.4, TXNDC5, LINC02384, CCR10, BFSP2, APOBEC3A, AC106897.1" compareCelltypes( tissue = "large intestine", celltypes = c("Plasma Cells","IgA-secreting Plasma Cells","IgG-secreting Plasma Cells","IgM-secreting Plasma Cells"), marker = marker, species = "human", output_file = "plasama_cell_subtype" )R
4. Subclustering Analysis
This agent can be used to study subclustered populations, such as a T cell population or a fibroblast cluster. We recommend applying the default Cassia first, and on a target cluster, applying the Seurat pipeline to subcluster the cluster and get the FindAllMarkers results to be used here.
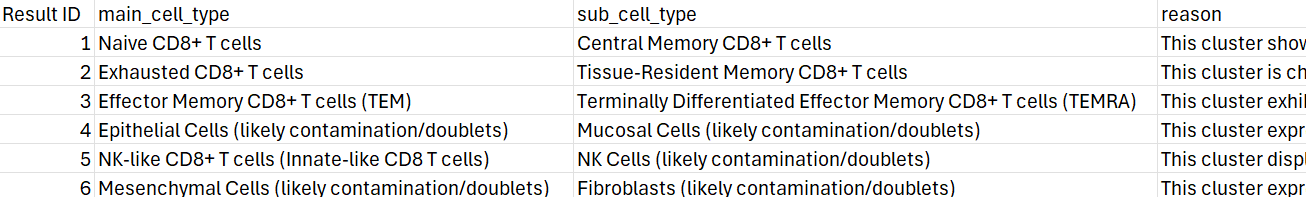
Here we present the results for the CD8-positive, alpha-beta T cell cluster analyzed previously as an example. This cluster is a CD8 population mixed with other non-CD8 T cell types.
# Example code for subclustering (abbreviated) # large <- readRDS("seurat_object.rds") # cd8_cells <- subset(large, cell_ontology_class == "cd8-positive, alpha-beta t cell") # # # Standard Seurat preprocessing workflow # cd8_cells <- NormalizeData(cd8_cells) %>% # FindVariableFeatures() %>% # ScaleData() %>% # RunPCA() %>% # FindNeighbors(dims = 1:20) %>% # FindClusters(resolution = 0.3) %>% # RunUMAP(dims = 1:20) # # # Find markers and save results # cd8_markers <- FindAllMarkers(cd8_cells, only.pos = TRUE, min.pct = 0.1, logfc.threshold = 0.25) %>% # filter(p_val_adj < 0.05) # write.csv(cd8_markers, "cd8_subcluster_markers.csv") marker_sub=loadExampleMarkers_subcluster() runCASSIA_subclusters(marker = marker_sub, major_cluster_info = "cd8 t cell", output_name = "subclustering_results") #To better capture the mixed signal, specify the major_cluster_info as "cd8 t cell mixed with other celltypes" instead runCASSIA_subclusters(marker = marker_sub, major_cluster_info = "cd8 t cell mixed with other celltypes", output_name = "subclustering_results2")R
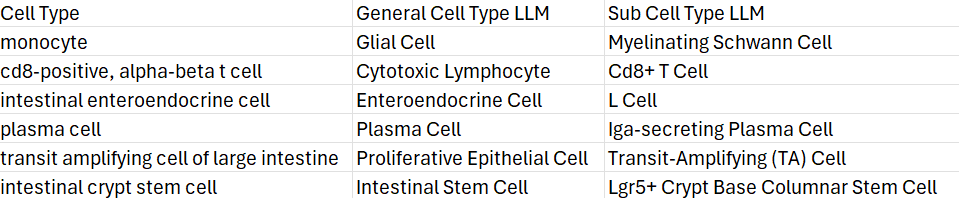
A CSV file will be generated containing the subclustering results. The image below shows an example of the output, with detailed annotations and reasoning for each subcluster.
It is recommend to run the CS score for the subclustering to get a more confident answer.
runCASSIA_n_subcluster(n=5, marker_sub, "cd8 t cell", "subclustering_results_n", max_workers = 5,n_genes=50L) # Calculate similarity scores similarity_scores <- runCASSIA_similarity_score_batch( marker = marker_sub, file_pattern = "subclustering_results_n_*.csv", output_name = "subclustering_uncertainty", max_workers = 6 )R
5. Additional Tasks
CASSIA can be used to perform specialized analyses on specific clusters, such as inferring the functional state or activation status of a cell population. In this example, we demonstrate this capability using CD8-positive, alpha-beta T cells. While this feature provides valuable insights, please note that the performance of this analytical agent has not been comprehensively benchmarked against gold standards, so interpret results with appropriate caution and validate findings with orthogonal methods when possible.
# Only openrouter is supported as the provider now. runCASSIA_annottaionboost_additional_task( full_result_path = paste0(output_name, "_full.csv"), marker = markers_unprocessed, output_name="T_cell_state", cluster_name = "cd8-positive, alpha-beta t cell", # Cluster with high mitochondrial content major_cluster_info = "Human Large Intestine", num_iterations = 5, model = "anthropic/claude-3.5-sonnet", additional_task = "infer the state of this T cell cluster" )R
See the other vignettes for more details on marker file preparation and basic annotation. If you have suggestions for additional agents or improvements, please contribute on GitHub.